In his last press conference Mario Draghi said that the ECB was ready for negative deposit rates if necessary. His comments led to several European bankers rejecting this as a possibility (here and here). The comments of the Deutsche Bank and Commerzbank CEOs reflect on either their ignorance of how monetary policy works or their fighting against an ECB action that could make their lives harder (and their profits lower).
Martin Blessing from Commerzbank argues that "too much cheap credit could lead to future crises" and he concludes that he does not know "how too much cheap liquidity can solve a problem that was created by too much cheap liquidity." This argument has now been wrongly used for 5 years, I thought that by now we would have learned that this is the wrong analogy.
Fischen from Deutsche Bank complains that setting negative interest rates on deposits at the ECB would be like "penalizing banks". And this "will later be felt in a painful manner so that's what I've been warning about" (a threat?). This is the usual argument that banks are so important that you cannot do anything that annoys them. But what if negative interest rates are the right equilibrium value? In what way are we penalizing banks? Banks can go and invest their funds somewhere else if they find that this is not a competitive rate. In addition, it is not uncommon to have these CEOs arguing that what the Euro zone needs (in particular countries in the periphery) is a large reduction in wages. I guess this is fine. "Penalizing" workers is ok because they do not pose any systemic risk to the economy as a whole.
Antonio Fatás
Sunday, November 24, 2013
Wednesday, November 20, 2013
Saving glut or investment dearth?
Martin Wolf at the Financial Times argues that the future of the world economy, in particular that of advanced economies, looks sluggish because investment rates have displayed a downward trend over recent years, even before the financial crisis started. I made similar points in my blog post yesterday, let me add some evidence to that story.
It is a fact that since the mid 1990s interest rates in the world started a downward trend. This trend was explained by Ben Bernanke in his March 2005 speech
“To be more specific, I will argue that over the past decade a combination of diverse forces has created a significant increase in the global supply of saving--a global saving glut--which helps to explain the relatively low level of long-term real interest rates in the world today”
This can easily be represented in a standard demand and supply chart for the global market for funds where the saving glut is simply a shift of the saving (supply) curve to the right.

What was interesting about the saving glut hypothesis is that it not only explained the decrease in interest rates but it was also able to account for the growth in global imbalances. One simple way to represent that is to separate the world in two blocks: those whose saving increased and the rest of the world. We can use again a simple demand and supply chart to represent this two group of countries: we represent the countries whose saving was increasing on the left hand side and the rest of the world on the right hand side to get the following picture:

This shows that we should expect the countries that increase their saving to display a growing current account surplus and the countries where the two curves are not shifting to display a growing current account deficit. This simple framework matches well the data during those years. Current account surplus in countries such as Germany, Japan, Oil producing countries, China and other emerging markets in Asia increased while deficits in countries such as the US and Greece, Spain, Portugal, Ireland, the UK increased as well. Here is the data (from the IMF World Economic Outlook):

But in this story there were some predictions that were never tested. In particular, as interest rates fell, investment should have increased globally. If you look at the saving and investment curves above, investment should have increased both in countries where the supply of saving was shifting as well as in the other countries. Unless we believe that investment rates do not depend on the interest rates we should have seen a generalized increased in investment around the world. Did we see that? No. In fact in advanced economies (including the US, as I showed yesterday) we have seen the opposite. Below is a chart that I have constructed using data from the IMF (World Economic Outlook database). I have calculated the aggregate investment rate (as % of GDP) for all advanced economies using the GDP share of each of these countries as weights [using PPP adjusted weights makes no difference for these countries].

There is a clear downward trend in the data. Even if we ignore the post-2008 data. the expansion in the 2000s was weaker that that of the 90s or the 80s. And remember that we expected exactly the opposite. The only way to make this last chart compatible with the saving glut story is to argue that at the same time that the saving curve was shifting to the right in some countries, the investment curve was also shifting (this time inwards) in other countries.

The shift of the investment curve would also help explain the lower interest rate during the decade. But in addition it would explain why growth rates (and labor market performance) remained weak during the expansion of the 2000s in some advanced economies. And given what we have seen so far during the current expansion it might be a source of additional pessimism about the coming years.
Antonio Fatás
Tuesday, November 19, 2013
Bubbles, interest rates and full employment.
The presentation of Larry Summers at a recent IMF conference has generated a good amount of comments. While some of what he said was not completely new, the way he put together some of these ideas to present a fairly pessimistic view of the state of the US economy has led to a debate around the possibility of secular stagnation (see Krugman). Secular stagnation refers to the fact that some of the output losses during the crisis become permanent, the economy does not ever return to the previous trend.

But there was something else that Larry Summers discussed that I also find interesting: he referred to the fact that in previous expansions the US economy barely managed to reach full employment despite the existence of strong bubbles and excesses. This also leads to a pessimistic view of the recent years and not so much because of what happened after 2008 but what happened before 2008.
Here is some data and a story to make you share that pessimism: it is a fact that global real interest rates during the last expansion (2001-2007) were very low by historical standards. The main candidate to explain low real interest rates is the saving glut that Ben Bernanke referred to in his 2005 speech to describe the increase in the pool of global saving coming from Asia, Germany, Japan and oil producing countries. As saving increase, the world interest rate fell. In other countries (such as the US and some European countries), this led to an increase in spending and borrowing that resulted in an increase in global imbalances.
But if what we saw in these years was an increase in the pool of saving that drove down interest rates we should expect investment to increase (as supply shifts we move along a downward slopping demand curve to find the new equilibrium price). And if investment increases we should expect an increase in growth rates. But none of this happened. In fact, investment not only did not go up but it was lower than what it had been in previous expansions as shown in the chart below (data is for the US economy).
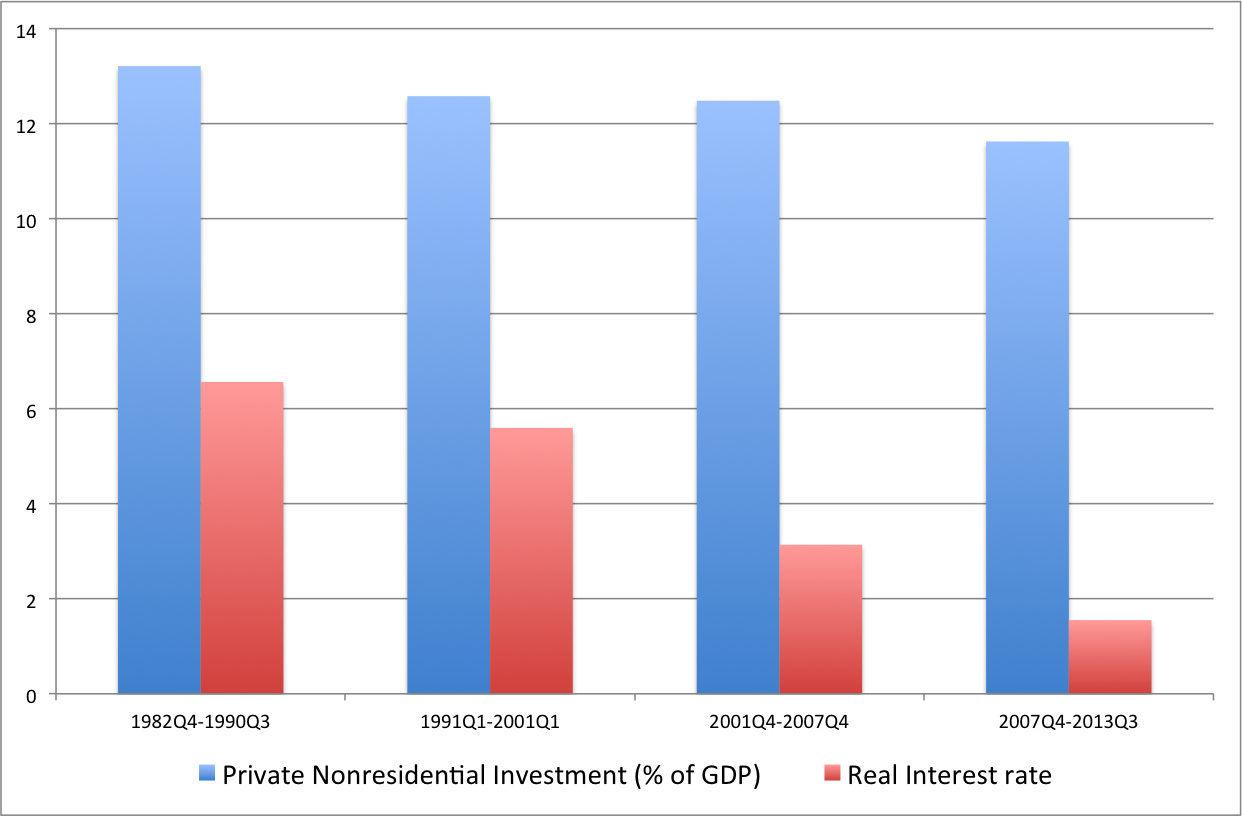
When we compare the last four expansions in the US economy we can see that while the real interest rate kept going down (especially in the 2001-2007 expansion), investment rates remained flat or even declined. I have included the current expansion in the chart although is not comparable to the others as it has not finished yet.
What happened to investment? Why didn't it go up as real interest rates fell and the pool of saving was increasing? I am not sure we have an answer to these questions but what the data suggests is that we are not just facing the negative consequences of a deep recession, we should also have some concerns about the strength of the recovery based on the weakness of investment in the previous expansion (once we take into account the low level of interest rates).
Antonio Fatás
Sunday, November 17, 2013
Europe: lack of reforms or austerity?
In a recent Vox article, Lorenzo Bini Smaghi raises some questions about the argument that austerity is the main reason why European countries' growth rates have been so low since 2008. To be fair, he is open to the idea that austerity has done some damage but he suggests that structural issues are also responsible for what we have seen in Southern European countries.
His main argument can be summarized by a set of charts where growth during the 2008-2012 period is shown to be negatively correlated to measures of competitiveness. For example, comparing growth during the crisis with the competitiveness index produced by the World Economic Forum, one gets the following correlation:

So the argument is that the low growth performance of Southern Europe (and Ireland) during the crisis is related to their structural problems.
I will not disagrees with the statement that some of those countries have structural weaknesses that can constraint their growth rates. But I find that the chart above does not provide much insights on how much growth reforms could deliver or the extent to which lack of reforms are behind the depth of the recession in these countries.
My concern is the use of only 4 years to assess the effects of competitiveness. If structural weaknesses matter so much, they should affect growth in the long term (not just during crisis). If one compares the evolution of GDP growth since 1994 among some of these countries, the picture looks very different (click on the image for a larger version)

For every year in the period 1994-2009 (without exception) growth in Spain or Greece was higher than in Germany (and without the exception of 1998 this is also true when compared to Austria). It is only during the years 2010-2012 where Austria and Germany display faster growth rates than Spain and Greece. And it is in those years that austerity was the strongest. So what we have is countries where the amplitude of the business cycle is much larger. They did better during the good years and now they are doing worse, which is not a big surprise (e.g. the volatility of emerging markets tends to be larger than that of advanced economies). And given what happened in those years in terms of austerity and the fact that financial markets remain dysfunctional it is even less of a surprise. No doubt that structural weaknesses exist in these countries but their connection to growth is a complex one and cannot simply be assessed by looking at the last three years.
Antonio Fatás
Wednesday, November 13, 2013
Why Sinn was wrong to write this FT article
When I teach these days about the negative performance of the Euro economies over the last six years I always get asked about how policy makers could get it so wrong. The answer can be found in the article that Hans-Werner Sinn published today in the Financial Times (Why Draghi was wrong to cut interest rates). It is hard to know where to start commenting on the article. It is not only inconsistent but also full of arguments that go against any economic logic and misleading use of partial data.
Interestingly, the article starts with the argument that given that inflation in the Euro area is below its target and falling (down to 0.7% in October), it seems that "last week's interest rate cut is understandable". Correct. That's the only reasonable paragraph of the article as the next one opens with the sentence:
"However, deflation in parts of a currency union is not the same as deflation of a union as a whole, because its internal effects on competitiveness cannot be compensated for by exchange rate adjustment.".
Let me start with the first part of the sentence. It is interesting proposition to argue that the ECB should not manage just average inflation (and growth?) but also try to manage these variables at the regional variable. This is not the mandate of the ECB. And what is exactly what Hans-Werner Sinn proposes, that the ECB tries to keep inflation in any region (country?) of the Euro area below 2%? This will imply overall deflation in the Euro area.
The second part of the sentence is even worse. If it is true that we need a realignment of relative prices within the Euro area, you will NOT get it by keeping inflation low. The article argues that the "printing presses" from Souther Europe have slowed down the realignment of the relative prices of goods needed for improving competitiveness. Wrong. There is plenty of evidence that prices and wages exhibit downward nominal rigidity and that it is much easier to allow changes in relative prices when inflation is positive. It is the low inflation level of the Euro area that is limiting the adjustment in relative prices (Krugman makes this point today in his blog).
The article also argues that the ECB policies have kept the value of the Euro down and this is one of the reasons why the German economy is running a current account surplus (not sure which chart he is looking at to argue that the value of the Euro is low...).
Antonio Fatás
Subscribe to:
Posts (Atom)